

Software keeps changing faster and faster. Therefore it is wise to always be prepared for yet another change in tooling. For instance, prepare for changes in data logging. When tooling changes, logging, log collection and log output changes accordingly. This is where fluentbit comes in handy.
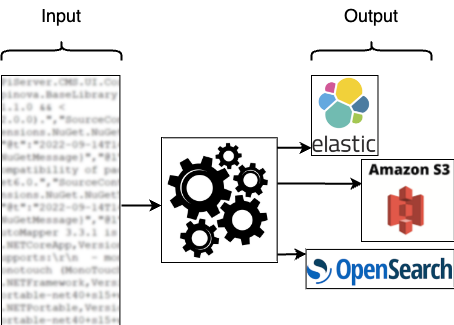
From applications and hardware, a lot of data is generated. The data can originate from logs (access, system, database), metrics (CPU, memory, storage) and more sources. These files and streams can be collected by different tools and plugins or dumped on the filesystem.
Output for analysis is done by a tool of choice, as shown in the diagram.
From log appender to StdOut
In our situation, we moved Java applications from a ‘classic’ VM environment to a Kubernetes environment. Our Java applications used log appenders, creating output in a Gelf (Graylog Extended Log Format) format. This application output is picked up by Gelf log collectors, stored in the database of choice (OpenSearch or Elastic) and eventually shown in a Graylog dashboard.
To be less dependent on the logging input and output, we started using fluentbit.
In our environment we let our applications write logs to stdout. We have chosen stdout because it’s the most standard way of logging.
To collect logs from the stdout of our application containers, fluentbit is installed as a deamonset on our K8s system. In this way, every node has a fluentbit pod with a very small footprint. Every fluentbit pod collects log data from the node it is running on and sends it via a data pipeline, as shown below, to its destination which is Graylog in our situation.
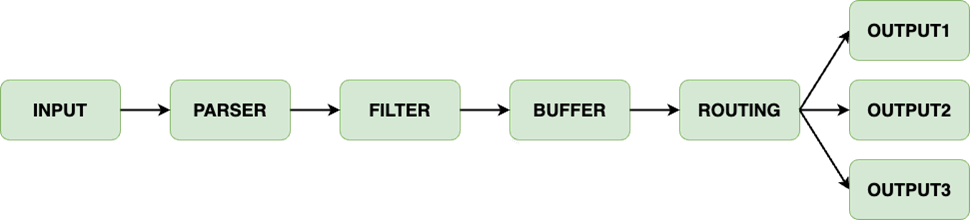
The data Pipeline consists of the following elements:
− Input (using plugins)
− Parser (unstructured to structured)
− Filter (change and enrich)
− Buffer (aggregate, calculations)
− Routing to output (using plugins)
Pod logging is only one of the many ways fluentbit collects data. Many plugins exist, to collect (sys)log, host metrics, cpu, memory or storage info.
Pod logging to stdout, Graylog and Splunk
In the code snippet below, you see how we configured fluentbit to fit our needs. Let’s analyze the Kubernetes ConfigMap we configured for the fluentbit installation.
[PARSER]
In the custom_parser.conf we define the parser to be used. The parser is used for structuring the log entry and we use one of the pre-configured ones for JSON structured Docker logging.
[SERVICE]
Describes the global behavior of fluentbit. The Parsers_File points to the file containing the parser. The Log_Level is set to info and can be changed according to your needs.
[INPUT]
We use the tail plugin to parse all log files for Docker and tag them with a kube.* It is possible to tag specific container loglines with a different Tag to distinguish them later on in the pipeline.
[FILTER]
The Kubernetes filter is added to enrich the log files with Kubernetes (meta)data. For our Graylog output we want to have the container name with a key called ‘source’. To do that the nest (lift) plugin is combined with the modify plugin. An example output is added under the ConfigMap section.
[OUTPUT]
The ConfigMap shows three kinds of output. The stdout pushes all logging to the fluentbit pod logging. This option is useful for debugging, but not advisable for your everyday setup.
Gelf output is used to send the logs directly to our Graylog input. Some of our data is also sent to Splunk and therefore a Splunk output is added as well.
---
apiVersion: v1
kind: ConfigMap
metadata:
  name: fluent-bit-config
  labels:
    k8s-app: fluent-bit
data:
  custom_parsers.conf: |
    [PARSER]
        Name docker
        Format json
        Time_Keep Off
        Time_Key time
        Time_Format %Y-%m-%dT%H:%M:%S.%L

  fluent-bit.conf: |
    [SERVICE]
        Daemon            Off
        Flush             1
        Log_Level         info
        Parsers_File      custom_parsers.conf
        HTTP_Server       On
        HTTP_Listen       0.0.0.0
        HTTP_Port         2020
        Health_Check      On

    [INPUT]
        Name              tail
        Tag               kube.*
        Path              /var/log/containers/*.log
        DB                /var/log/flb_kube.db
        Parser            docker
        multiline.parser  docker
        Mem_Buf_Limit     50MB
        Skip_Long_Lines   Off
        Refresh_Interval  10
        Key               log

    [FILTER]
        Name              kubernetes
        Match             kube.*
        Kube_Tag_Prefix   kube.var.log.containers.
        Merge_Log_Key     log
        Merge_Log         On
        Keep_Log          Off
        Labels            Off
        Annotations       Off
        Buffer_Size       0

    [FILTER]
        Name              nest
        Match             *
        Wildcard          container_name
        Operation         lift
        Nested_under      kubernetes
        Add_prefix        kubernetes_

    [FILTER]
        Name              modify
        Match             *
        Copy              kubernetes_container_name source

    [OUTPUT]
        Name stdout
        Match *

    [OUTPUT]
        Name                    gelf
        Match                   *
        Host                    graylog
        Port                    12201
        Mode                    udp
        Gelf_Short_Message_Key  log

    [OUTPUT]
        Name                    splunk
        Match                   kube.*
        Host                    splunkhost.local
        port                    8088
        Splunk_Token            **SPLUNK TOKEN**
        tls                     on
        tls.verify              off
        Splunk_Send_Raw         On
Below, an example of nest and modify operations.
Before:
[306] kube.var.log.containers.mailhog-5cc8bf779d-jbm8n_log-ns-mailhog-7890.log: [1678721800.491832722,
     {"log"=>"2023-03-13T15:36:40.491591995Z stdout F     "Helo": "management-67dc85899c-7kdz5"", "kubernetes"=>{"pod_name"=>"mailhog-5cc8bf779d-jbm8n", "namespace_name"=>"log-ns", "pod_id"=>"1234", "host"=>"worker-10", "container_name"=>"mailhog", "docker_id"=>"5678", "container_hash"=>"harbor/mailhog@sha256:0000", "container_image"=>"harbor/mailhog:1.0.0"}}]
After:
[306] kube.var.log.containers.mailhog-5cc8bf779d-jbm8n_log-ns_mailhog-7890.log: [1678722216.686864246,
     {"log"=>"2023-03-13T15:43:36.681074328Z stdout F     "Helo": "management-67dc85899c-7kdz5"", "kubernetes_pod_name"=>"mailhog-5cc8bf779d-jbm8n", "kubernetes_namespace_name"=>"log-ns", "kubernetes_pod_id"=>"1234", "kubernetes_host"=>"worker-10", "kubernetes_container_name"=>"mailhog", "source"=>"mailhog", "kubernetes_docker_id"=>"5678", "kubernetes_container_hash"=>"harbor/mailhog@sha256:0000", "kubernetes_container_image"=>"harbor/mailhog:1.0.0"}]
As you see, the container_name key is lifted from the kubernetes key and becomes kubernetes_container_name. Next to that, the key is modified to source (‘mailhog’). This modified output can help to structure dashboards in Graylog.
Next steps
As shown in the short explainer above, it is possible to structure Kubernetes log data and send it to a destination of choice. Lots of plugins are available.
You need to be aware of one pitfall. When changing the configmap, containing the configuration, the pods using that configmap will not automatically be updated. For that, the pods must be restarted. It is not done by fluentbit. Fortunately solutions exist. An easy one is: the fluent operator.
Enjoy!


